Analyzing memory leaks in .NET applications running in production
Intro
I had this situation where an application that was running in production was getting bigger and bigger until it would devour all memory. I had to fix the problem, but how could I identify the cause? Running it on my computer wouldn't lead to the same increase in memory, what I wanted to see was why a simple web API would take 6Gb in memory and keep growing.
The process is simple enough:
- Get a memory dump from the running process
- Analyze the memory dump
While this post relates specifically to process memory dumps, one can get whole memory dumps and analyze those. There are two types of process memory dump formats: mini and full. I will be talking about the full format.
Fortunately, for our process, there are only two steps. Unfortunately, both are fraught with problems. Let's go through each.
Getting a memory dump from a running process
Apparently that is as simple as opening Task Manager, right clicking on the running process in the Details tab and selecting Create dump file. However, what this does is suspend the process and then copy all of its memory in a file in %AppData%/Local/Temp/[name of process].dmp. If the process is being watched or some other issue occur, the dumping will fail. Personally, I couldn't dump anything over 2Gb when I was trying to get the info from w3wp.exe (the IIS process) as the process would restart.
There are a lot of other ways of getting a process memory dump, including crash dumps, periodic dumps, event driven dumps. ProcDump, one of the utilities in the free SysInternals suite, can do all of those. The Windows Error Reporting (WER) system also generates dumps for faulty or unresponsive application or kernel. Other options for collecting a dump are userdum.exep, Windows Debugger (ntsd or windbg). Process Explorer, of course, can create two types of memory dumps for a process: mini and full.
Analyzing a process memory dump
This is where it gets tricky. What you would like is something that opens the file and shows a nice interactive interface explaining exactly what hogs your memory. Visual Studio does that, but only the Ultimate version gives you the memory analysis option. dotMemory from JetBrains is great, but it also costs a lot of money.
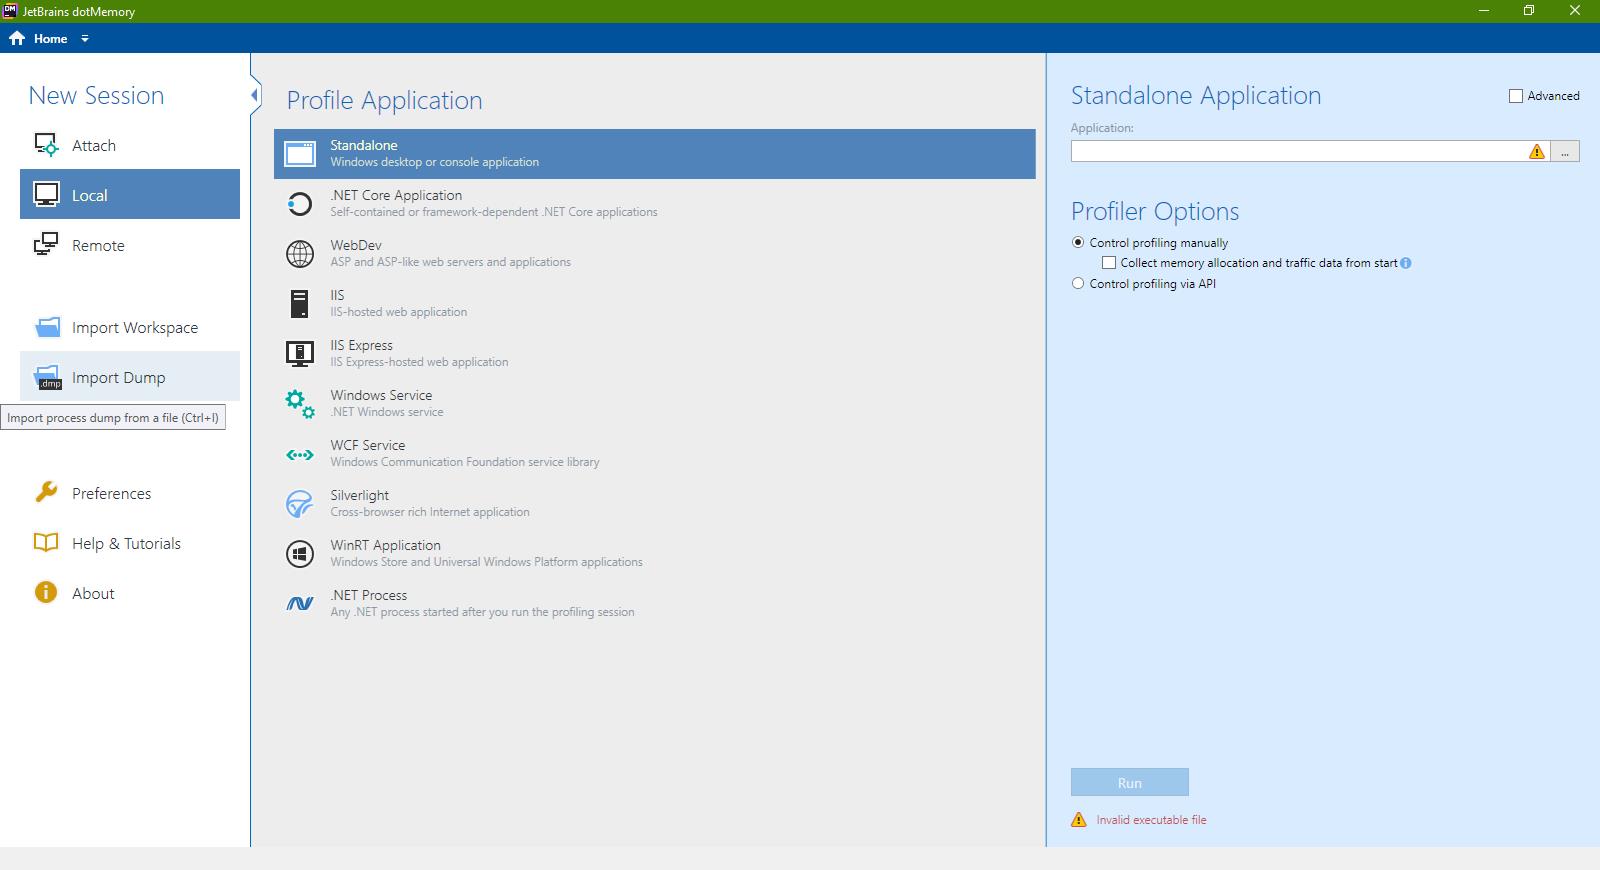
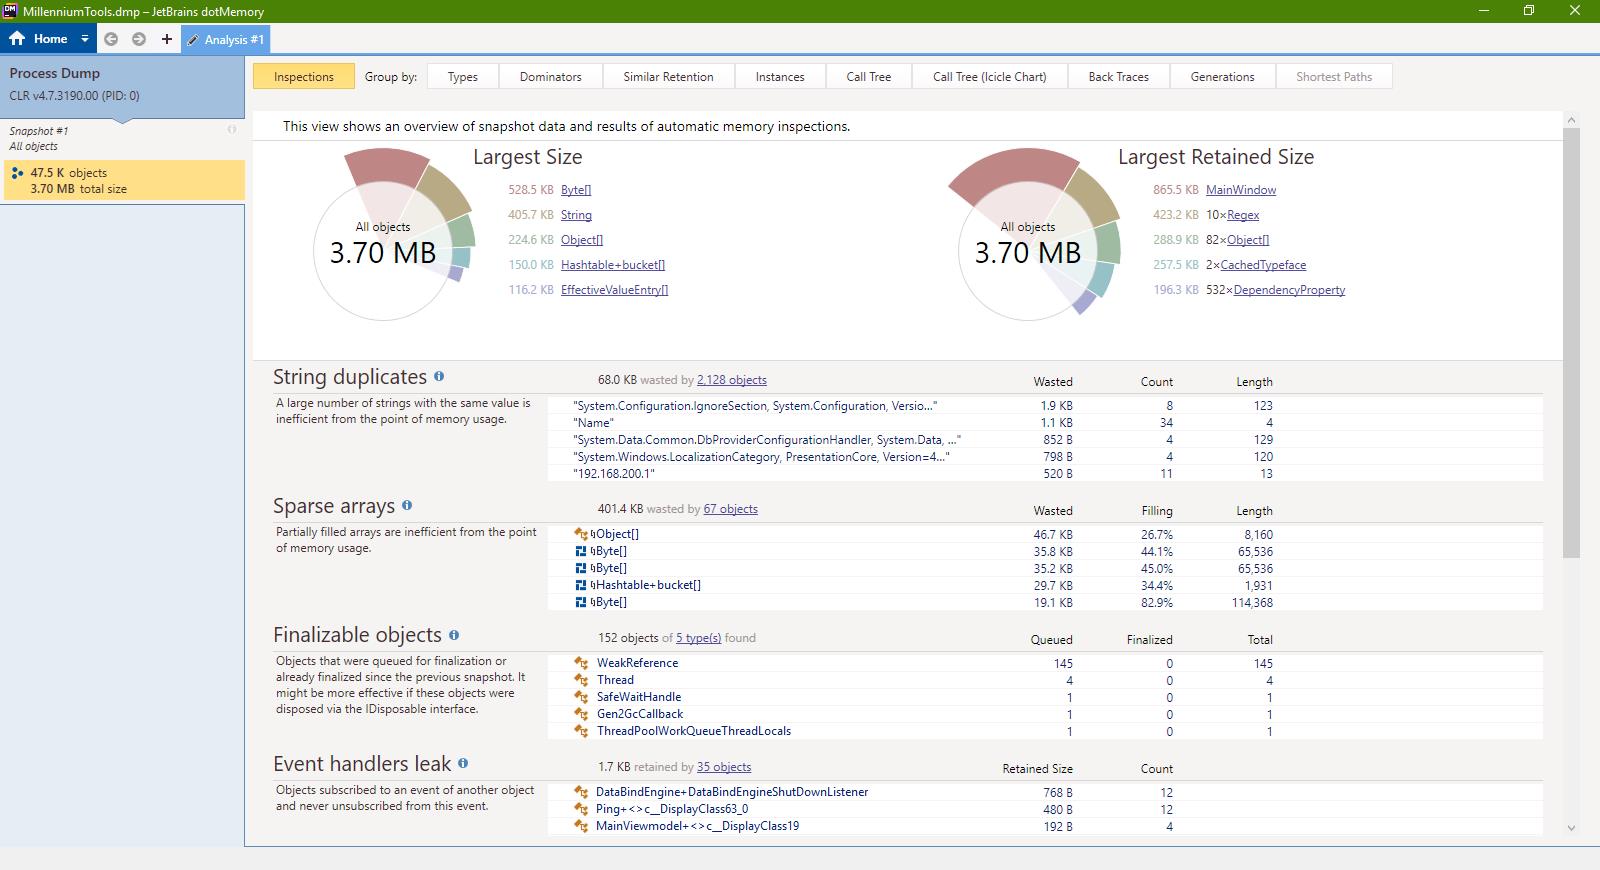
My personal experience was using dotMemory in the five days in which it is free and it was as seamless as I would have wanted: I opened the file, it showed me a pie graph with what objects were hogging my memory, I clicked on them, looked where and how they were stored and even what paths could be taken to create those instances. It was beautiful.
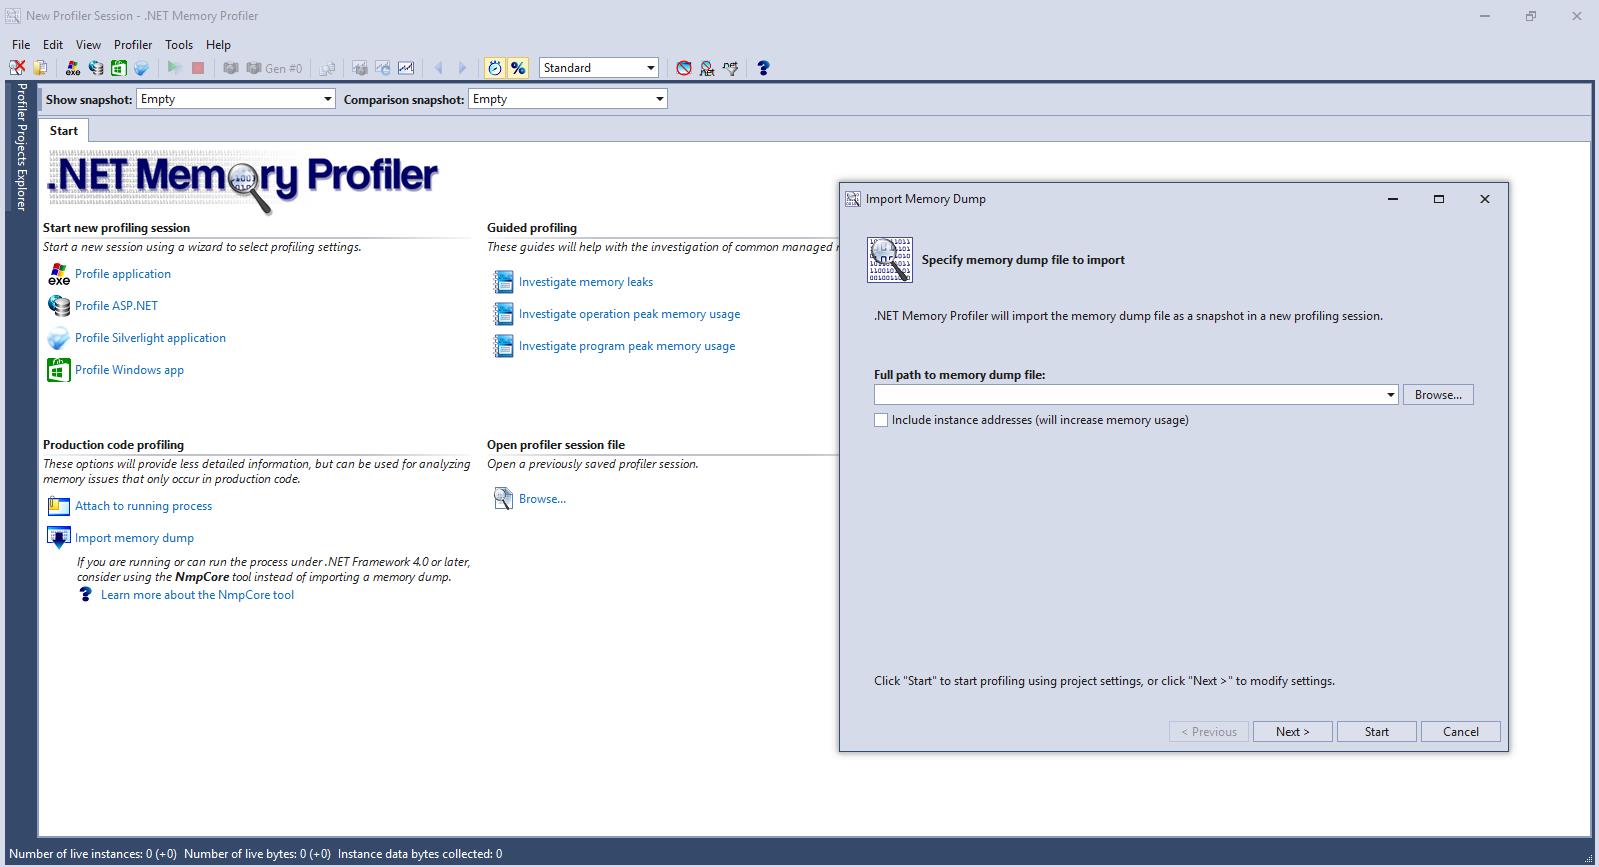
Another option is SciTech's .NET Memory Profiler, but it is also rather expensive. I am sure RedGate has something, too, but their trials are way to intrusive for me to download.
I have been looking for free alternatives and frankly all I could find is WinDBG, which is included in Windows Debugging Tools.
Windows Debugger is the name of the software. It is a very basic tool, but there are visualizers which use it to show information. One of them is MemoScope, which appears unmaintained at the moment and is kind of weird looking, but it works. Unfortunately, it doesn't even come close to what dotMemory was showing me. If analyzing a random .NET app dump showed that the biggest memory usage was coming from MainWindow (makes sense) which then had a lvItems that held most of memory (it was a ListView with a lot of data), WinDbg and therefore MemoScope show the biggest usage comes from arrays of bytes. And it also makes sense, physically, but there is no logical context. A step by step memory profiling guide using WinDbg can be found here.
Conclusion
I am biased towards JetBrains software, which is usually amazing, although I haven't used it a quite a while because their obnoxious licensing system (you basically rent the software). I loved how quickly I got to the problem I had with dotMemory. .NET Memory Profiler from SciTech is way cheaper and seems to point in the right direction, but doesn't really compare in terms of quality. Anything else I've tried was quite subpar.
Doing it yourself
As they say, if you want to do something right, you gotta do it yourself.
There is a Windows API called MiniDumpWriteDump that you can use programatically to create the dumps. However, as you've seen, that's not the problem, the dump analysis is.
And it's hard to find anything that is not very deep and complicated. Memory dumps are usually analysed for forensic reasons. There are specialists who have written scores of books on memory dump analysis. What's worse, most people focus on crash dumps, with memory leak analysis usually done while debugging an application.
I certainly don't have the time to work on a tool to help me with this particular issue. I barely had the time to look for existing tools. But if you, guys, can add information to this blog post, I am sure it will help a lot of people going through the same thing.
Pretty Pictures
I didn't find a nice way of putting the images in the post's text, I am adding them here.


Comments
Be the first to post a comment